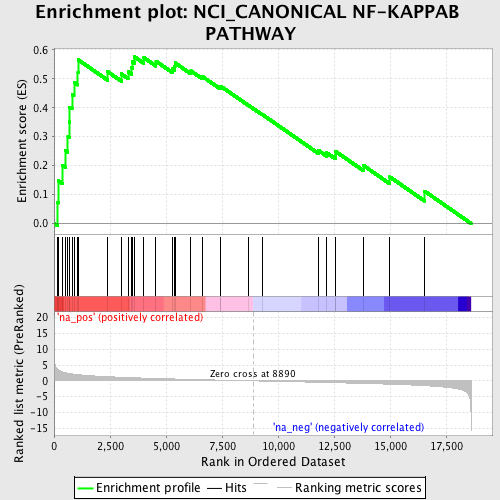
Profile of the Running ES Score & Positions of GeneSet Members on the Rank Ordered List
| Dataset | set04_DMproB_versus_LMproB |
| Phenotype | NoPhenotypeAvailable |
| Upregulated in class | na_pos |
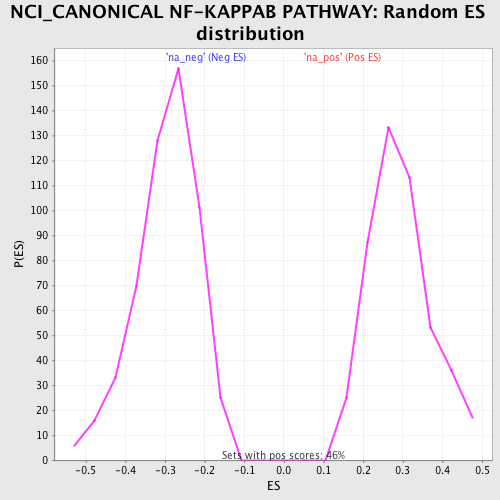
| GeneSet | NCI_CANONICAL NF-KAPPAB PATHWAY |
| Enrichment Score (ES) | 0.5759013 |
| Normalized Enrichment Score (NES) | 1.9547248 |
| Nominal p-value | 0.0 |
| FDR q-value | 0.11457798 |
| FWER p-Value | 0.258 |
| PROBE | GENE SYMBOL | GENE_TITLE | RANK IN GENE LIST | RANK METRIC SCORE | RUNNING ES | CORE ENRICHMENT | |
|---|---|---|---|---|---|---|---|
| 1 | RELB | 157 | 3.603 | 0.0727 | Yes | ||
| 2 | BCL3 | 191 | 3.413 | 0.1478 | Yes | ||
| 3 | RIPK2 | 386 | 2.807 | 0.2006 | Yes | ||
| 4 | ARRB2 | 508 | 2.577 | 0.2521 | Yes | ||
| 5 | IKBKG | 617 | 2.420 | 0.3008 | Yes | ||
| 6 | NFKB2 | 672 | 2.356 | 0.3509 | Yes | ||
| 7 | TNFRSF1A | 694 | 2.313 | 0.4019 | Yes | ||
| 8 | MAPK14 | 804 | 2.181 | 0.4452 | Yes | ||
| 9 | CYLD | 888 | 2.101 | 0.4880 | Yes | ||
| 10 | BCL10 | 1064 | 1.959 | 0.5227 | Yes | ||
| 11 | NOD2 | 1082 | 1.941 | 0.5655 | Yes | ||
| 12 | ATM | 2389 | 1.310 | 0.5248 | Yes | ||
| 13 | TNF | 2999 | 1.123 | 0.5173 | Yes | ||
| 14 | MAP3K14 | 3303 | 1.045 | 0.5245 | Yes | ||
| 15 | IKBKB | 3468 | 0.998 | 0.5382 | Yes | ||
| 16 | XPO1 | 3496 | 0.991 | 0.5590 | Yes | ||
| 17 | ERC1 | 3588 | 0.966 | 0.5759 | Yes | ||
| 18 | CHUK | 4007 | 0.874 | 0.5731 | No | ||
| 19 | NFKB1 | 4547 | 0.748 | 0.5609 | No | ||
| 20 | TNFAIP3 | 5291 | 0.603 | 0.5345 | No | ||
| 21 | NFKBIA | 5386 | 0.585 | 0.5426 | No | ||
| 22 | FBXW11 | 5399 | 0.583 | 0.5551 | No | ||
| 23 | MALT1 | 6108 | 0.454 | 0.5272 | No | ||
| 24 | PIK3R1 | 6623 | 0.366 | 0.5078 | No | ||
| 25 | PIK3CA | 7419 | 0.232 | 0.4703 | No | ||
| 26 | SYK | 7442 | 0.230 | 0.4742 | No | ||
| 27 | UBE2D3 | 8697 | 0.033 | 0.4075 | No | ||
| 28 | LCK | 9300 | -0.061 | 0.3765 | No | ||
| 29 | RELA | 11802 | -0.455 | 0.2521 | No | ||
| 30 | RAN | 12168 | -0.517 | 0.2441 | No | ||
| 31 | TRAF6 | 12559 | -0.587 | 0.2364 | No | ||
| 32 | REL | 12563 | -0.588 | 0.2495 | No | ||
| 33 | BIRC2 | 13823 | -0.808 | 0.1999 | No | ||
| 34 | SRC | 14989 | -1.055 | 0.1610 | No | ||
| 35 | PRKCA | 16539 | -1.517 | 0.1118 | No |